Time Series
来源:Time Series Forecasting using Python - Analytics Vidhya
简介
What is Time Series Analysis?
As the name ‘time series forecasting’ suggests, it involves working on time (years, days, hours, minutes) based data, to derive hidden insights to make informed decision making.
Importance of Time Series Analysis
Time series models are very useful models when you have serially correlated data as shown above. Most businesses work on time series data to analyze
- Sales numbers for the next year
- Website Traffic
- Competition Position
- Demand of products
- Stock Market Analysis
- Census Analysis
- Budgetary Analysis
This is just the tip of the iceberg and there are numerous prediction problems that involve a time component and concepts of time series analysis come into picture.
Why is Time Series Forecasting Challenging?
But what makes a time series more challenging than say a regular regression problem? There are 2 things:
- Time Dependence of a time series - The basic assumption of a linear regression model that the observations are independent doesn’t hold in this case.
- Seasonality in a time series - Along with an increasing or decreasing trend, most time series have some form of seasonal trends, i.e. variations specific to a particular time frame.
Introduction to Time Series
Time Series is generally data which is collected over time and is dependent on it.
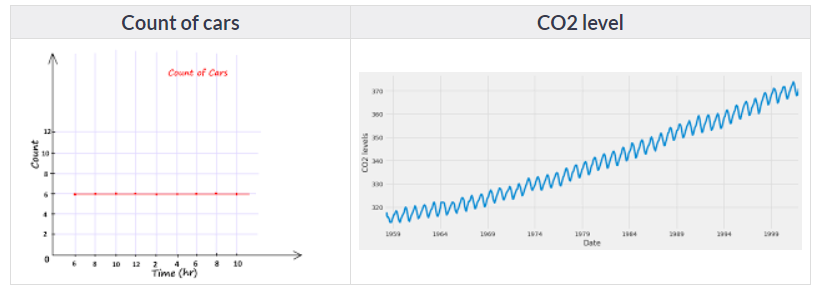
Here we see that the count of cars is independent of time, hence it is not a time series. While the CO2 level increases with respect to time, hence it is a time series.
Some of the examples of time series are:
Stock Price :

Passenger Count of an airlines :

Temperature over time :

Number of visitors in a hotel :

Trend
Trend is a general direction in which something is developing or changing.

↑ Here the red line represents an increasing trend of the time series.
Seasonality
Another clear pattern can also be seen in the above time series, i.e., the pattern is repeating at regular time interval which is known as the seasonality. Any predictable change or pattern in a time series that recurs or repeats over a specific time period can be said to be seasonality.

↑ We can see that the time series is repeating its pattern after every 12 months i.e there is a peak every year during the month of January and a trough every year in the month of September, hence this time series has a seasonality of 12 months.
Difference between a time series and regression problem
- The main difference is that a time series is time dependent. So the basic assumption of a linear regression model that the observations are independent doesn’t hold in this case.
- Along with an increasing or decreasing trend, most Time Series have some form of seasonality trends,i.e. variations specific to a particular time frame.
So, predicting a time series using regression techniques is not a good approach.
Time series analysis comprises methods for analyzing time series data in order to extract meaningful statistics and other characteristics of the data. Time series forecasting is the use of a model to predict future values based on previously observed values.
Project
https://datahack.analyticsvidhya.com/contest/practice-problem-time-series-2/
Problem Statement
Unicorn Investors wants to make an investment in a new form of transportation - JetRail. JetRail uses Jet propulsion technology to run rails and move people at a high speed! The investment would only make sense, if they can get more than 1 Million monthly users with in next 18 months. In order to help Unicorn Ventures in their decision, you need to forecast the traffic on JetRail for the next 7 months. You are provided with traffic data of JetRail since inception in the test file.
Exploratory Analysis
原本的train.Datetime是Object格式,首先将数据类型转换为 datetime format
1 | train['Datetime'] = pd.to_datetime(train.Datetime,format='%d-%m-%Y %H:%M') |
1 | # indexing the Datetime to get the time period on the x-axis. |
1 | import matplotlib.pyplot as plt |

Split data
将训练数据划分为训练集与验证集
The starting date of the dataset is 25-08-2012 as we have seen in the exploration part and the end date is 25-09-2014.
1 | Train=train.ix['2012-08-25':'2014-06-24'] |
划分标准:将最后3个月的数据划分为验证集,其余为训练集,而不是随机划分。因为若是随机划分,则存在用future value去预测old value的情况,而this is not the case in real scenario.
ARIMA model
ARIMA Model的介绍可见:https://www.youtube.com/watch?v=0xHf-SJ9Z9U
ARIMA stands for Auto Regression Integrated Moving Average. It is specified by three ordered parameters (p,d,q).
- Here p is the order of the autoregressive model (number of time lags)
- d is the degree of differencing (number of times the data have had past values subtracted)
- q is the order of moving average model. We will discuss more about these parameters in next section.
The ARIMA forecasting for a stationary time series is nothing but a linear (like a linear regression) equation.
What is a stationary time series?
There are three basic criterion for a series to be classified as stationary series :
- The mean of the time series should not be a function of time. It should be constant.
- The variance of the time series should not be a function of time.
- THe covariance of the ith term and the (i+m)th term should not be a function of time.
Why do we have to make the time series stationary?
We make the series stationary to make the variables independent. Variables can be dependent in various ways, but can only be independent in one way. So, we will get more information when they are independent. Hence the time series must be stationary.
If the time series is not stationary, firstly we have to make it stationary. For doing so, we need to remove the trend and seasonality from the data. To learn more about stationarity you can refer this article: https://www.analyticsvidhya.com/blog/2015/12/complete-tutorial-time-series-modeling/